
Data Science Full Life Cycle
Data Science Full Life Cycle -Slack Messages

Introduction
Greetings, explorers! Join our venture into Slack’s data realm with CRISP-DM. From Business Understanding to Deployment, this isn’t just a task — it’s our collective odyssey. Uncover patterns and stories in Slack’s digital haven, sharing triumphs and challenges. Welcome to our data-driven exploration!
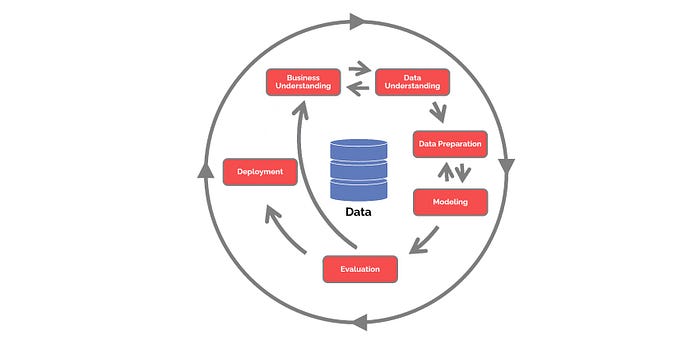
CRISP-DM Framework workflow
Dataset Description
This week’s challenge involves the use of anonymized Slack messages from Batch 6 within the 10 Academy training program. The dataset is meticulously organized into folders, each representing a distinct Slack channel. It comprises JSON files, offering a granular breakdown of conversations on individual days, providing a comprehensive glimpse into the communication dynamics of the training program participants.
Data Preparation
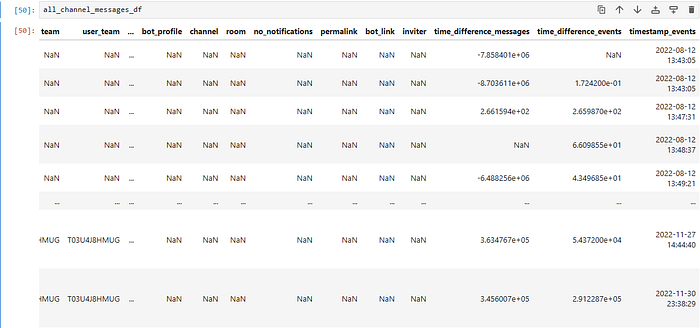
Upon gathering the extensive message data from 39 channels and 71 users in the 10 Academy training program, the crucial step of data preparation comes to the forefront. This intricate process involves meticulous cleaning, validation, and transformation of the dataset to shape it into a usable and insightful format. In its current state, the collected data boasts a substantial size, encompassing 20,010 rows and 43 columns, providing a rich tapestry of communication dynamics within the training program. This data preparation stage is pivotal in paving the way for a comprehensive and meaningful analysis of the Slack messages.
Data Cleaning
In the 10 Academy training program’s dataset with 39 channels and 71 users, data cleaning assumes a pivotal role. This process involves reformatting attributes, converting ‘Date’ to datetime, and addressing null values through appropriate imputation methods. A total of 10 columns with null values were treated, and columns with excessive unique values or inconsistencies were dropped. The dataset was streamlined by removing duplicate values to ensure unbiased analysis. This concise yet meticulous data cleaning paves the way for a refined dataset, laying the foundation for insightful analysis of Slack messages.
Data Exploration
This step was taken to better understand the data that had been gathered, give a full picture of the data, uncover and comprehend patterns that would explain unexpected results.
These are some of the explorations that was done.
Conducted a detailed examination of channel data, revealing insights that indicated the necessity for additional data cleaning and feature selection.
2D scatter plot where x-axis is the number of messages in the channel, y-axis is the sum of number of replies
Performed a time-based analysis and created a 2D scatter plot with the message timestamp and time of day relationship.
2D scatter plot such that x-axis is the time difference between the message timestamp and the first reply message, y-axis is the time of the day (in 24hr format)
Time differences and various consecutive events.
Distribution of Time Difference Between Consecutive Events (in minutes)
Through Message Classification, messages were categorized, showcasing proficiency in designing effective classification models. Topic Modeling uncovered key themes, revealing intricate patterns in unstructured text data. Sentiment Analysis discerned emotional tones, demonstrating expertise in NLP techniques.
Sentiment of messages over time for the whole data set time range
Topic Prediction Model: Uncovering Channel Insights
A predictive model has been developed to discern and predict topics raised in each channel. This model’s significance lies in its ability to efficiently distill patterns and themes within diverse conversations. By predicting topics, it accelerates the identification of trends and key areas of interest, streamlining the extraction of actionable insights from the extensive dataset. This predictive capability enhances the overall efficiency of navigating and understanding the collective pulse of communication within each Slack channel.
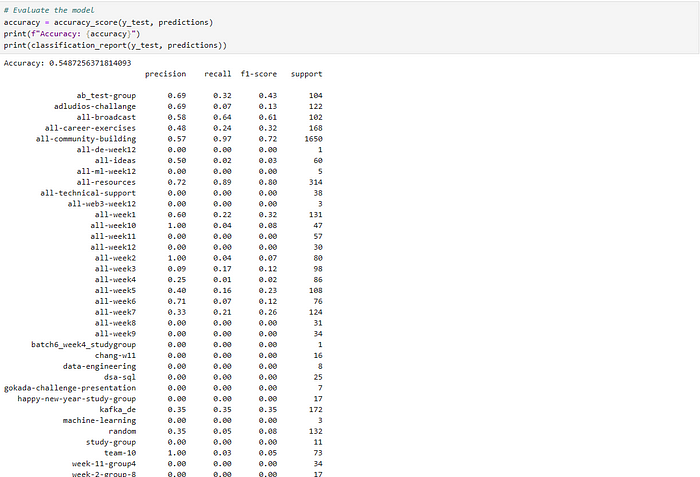
Model evaluation on the prediction results in each channel.
The presented model demonstrates an accuracy of 55% on the test set, reflecting its predictive performance. To further enhance accuracy:
Feature Engineering: Consider incorporating additional relevant features or refining existing ones to capture more nuanced information.
Hyperparameter Tuning: Optimize the parameters of the model to find the configuration that yields the best results.
Model Selection: Explore alternative models and algorithms to identify whether a different approach may yield superior performance.
Text Preprocessing: Refine the text preprocessing steps to better capture the underlying semantics of the messages.
Ensemble Methods: Experiment with ensemble methods to combine predictions from multiple models for improved accuracy.
These adjustments can contribute to a more robust and accurate model, ensuring a more precise identification of topics within the Slack channels and consequently enhancing the utility of the predictive insights.
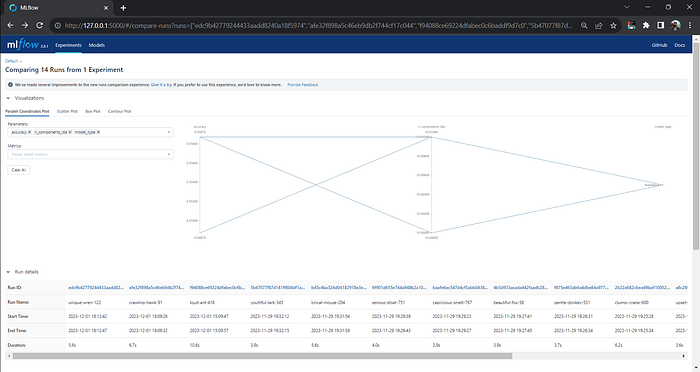
Efficient Experimentation: MLflow in Action
In our Week-0 Challenge exploration, we integrated MLflow, reshaping our experiment tracking and model management.
MLflow: Streamlining Experiments
Experiment Logging:
MLflow’s Tracking records and compares experiments, refining our models through detailed parameter and result tracking.
Parameters, Metrics, Artifacts:
MLflow simplifies parameter and metric management, streamlining model development. Artifact association links code, data, and results seamlessly.
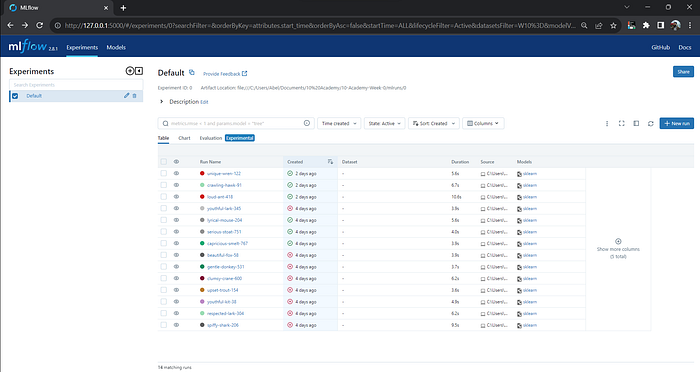
MLflow to keep track of models
MLflow’s Core Components
Tracking Dashboard:
Central to MLflow, the Tracking component acts as a collaboration hub, enabling effective reproduction and expansion of experiments.
Lifecycle Management:
MLflow spans the machine learning lifecycle, offering streamlined processes from experiment creation to model deployment for enhanced efficiency.
Reproducibility:
MLflow ensures experiment reproducibility, fostering collaboration and knowledge sharing.
Collaboration and Transparency:
By centralizing experiment details, MLflow promotes collaboration and transparency, creating a dynamic and innovative environment.
Dashboard of MLflow to track model features
With MLflow integrated into our data science toolkit, we embark on a journey of efficient experimentation, reproducibility, and collaboration.
Optimizing Data Storage for Deployment and Processing: A Hybrid Approach
In the dynamic landscape of data management, striking the right balance between flexibility and structure is paramount. In this journey of data optimization, we explore a dual-database strategy that combines the versatility of NoSQL for raw data with the reliability of PostgreSQL for feature storage.
NoSQL for Raw Data Flexibility
Leveraging NoSQL databases like MongoDB or Cassandra empowers us to store raw, unstructured data efficiently. The schema-less nature of NoSQL accommodates the evolving nature of raw information, capturing nuances such as user interactions, timestamps, and channel details without constraints.
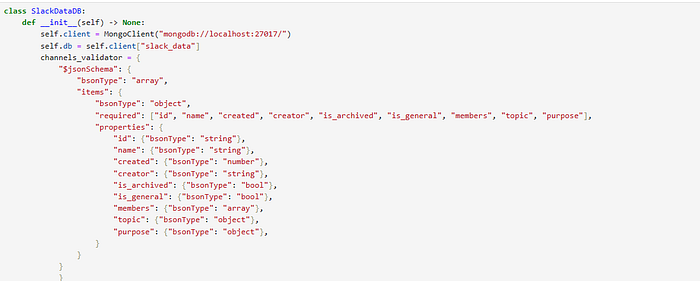
NoSQL Database schema with validator
PostgreSQL: Crafting a Schema for Features
Enter PostgreSQL, a robust relational database. Here, we craft a well-defined schema tailored for storing structured features derived from the raw data. Timestamps, sentiment scores, and user interactions find their organized places in tables, ensuring seamless retrieval and analysis.
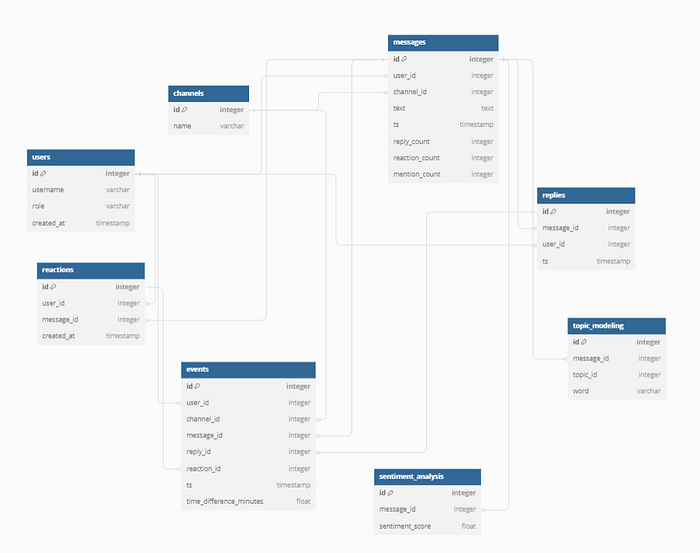
Relational Database Schema for postgress (Features)
Deployment Excellence: Crafting a Dynamic Dashboard
Embarking on the deployment phase, we’ve orchestrated a multi-functional dashboard that serves as a comprehensive window into channel dynamics. Rooted in React Vite for the frontend, Tailwind for aesthetics, and Flask for a robust backend, this dashboard encapsulates channel activity, analytics, top topics, and sentiment scores over time.
React Vite + Tailwind for Frontend Brilliance:
The frontend, a masterpiece in React Vite, harnesses the power of Tailwind for a sleek and responsive user interface. React Vite ensures fast, optimized performance, while Tailwind streamlines styling, resulting in an aesthetically pleasing and efficient user experience.
Flask: The Backbone of Backend Operations:
At the core of our backend operations stands Flask, a Python web framework known for its simplicity and versatility. Flask orchestrates the data flow, ensuring seamless communication between the frontend and the data repositories. It acts as the backbone, responding to requests and delivering data with precision.
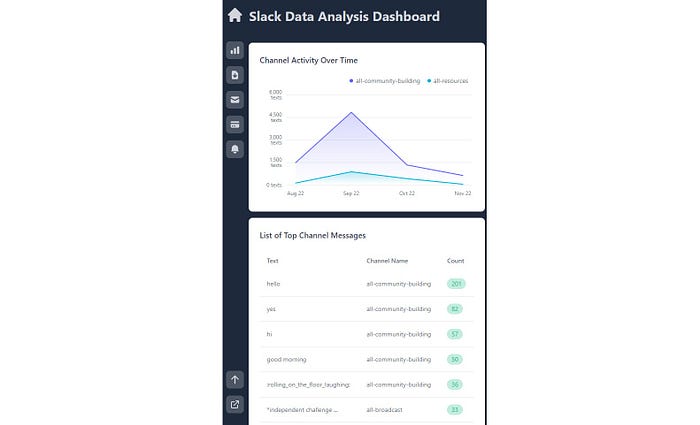
Dashboard Features Unveiled:
Channel Activity Over Time: A dynamic timeline showcasing the ebb and flow of channel activity. Users can track spikes, lulls, and patterns, gaining insights into communication dynamics.
Channel Analytics — Message Counts: A quantitative dive into channel analytics, providing an overview of message counts. This feature offers a quick grasp of each channel’s vibrancy.
Top Topics in the Channel: A curated list revealing the most-discussed topics in each channel. This feature accelerates the identification of trending subjects and popular discussions.
Sentiment Score of Each Channel: Unveiling the emotional tone within each channel, the sentiment score feature adds a layer of depth. It facilitates a nuanced understanding of the collective mood over time.
ScreenShot of the dashboard deployed
Why React Vite + Tailwind?
Speed and Performance: React Vite ensures rapid development and optimized performance, offering a seamless user experience.
Aesthetic Precision: Tailwind’s utility-first approach allows for precise styling, ensuring the dashboard is as visually appealing as it is functional.
Mobile view of the deployed dashboard
Flask: The Agile Facilitator:
Simplicity: Flask’s simplicity accelerates backend development, allowing for agile responses to frontend requests.
Versatility: From data retrieval to serving as the middleware, Flask adapts to diverse backend requirements with ease.
Insights and Conclusions: Navigating the Data Seas in a Digital Realm
10 Academy Week-0 Challenge: A Data Odyssey:
The 10 Academy Week-0 Challenge took us on a voyage through the seas of Slack messages. Employing the CRISP-DM framework, we navigated Business Understanding, Data Understanding, Data Preparation, Modeling, Evaluation, and Deployment. This comprehensive journey not only honed our data science skills but also illuminated the potential of data in deciphering communication nuances within a team.
Predictive Power Unleashed:
The development of a topic prediction model for Slack messages brought forth a tool of remarkable predictive capabilities. By discerning and predicting topics, this model accelerates trend identification and key theme extraction. Its deployment-ready structure, coupled with insights derived from accuracy evaluation, marks a significant step toward efficient communication analysis.
Hybrid Database Strategy: A Symphony of Structure and Flexibility:
The hybrid approach to data storage, marrying NoSQL for raw data and PostgreSQL for structured features, unveils a harmonious solution. This dual-database strategy not only ensures flexibility for evolving raw data but also provides a robust, structured foundation for feature storage. Its deployment-readiness sets the stage for real-time applications and continuous data processing.
Dashboard Mastery: Bringing Data to Life:
The deployment of a multi-function dashboard, crafted with React Vite, Tailwind, and Flask, opens a window into channel dynamics. From activity timelines to sentiment scores, the dashboard transforms data into actionable insights. This synthesis of frontend brilliance and backend agility stands as a testament to the power of dynamic visualization in enhancing data understanding.
Social Media’s Role in Shaping Work Environments:
Amidst the data-driven revelations, a broader insight emerges — the pivotal role of platforms like Slack in shaping modern work environments. Beyond data analysis, these channels serve as digital hubs where communication nuances, sentiments, and trends converge. The integration of data science into such platforms not only augments understanding but also underscores the evolving landscape of collaborative work.
Conclusion: A Symphony of Data, Platforms, and Insights:
In conclusion, our journey traversed diverse terrains, from dataset to Slack messages, predictive models, and hybrid database strategies. The deployment of dynamic dashboards further emphasized the transformative power of data visualization. As we step back and reflect, the synthesis of these insights not only propels data science forward but also highlights the indispensable role of social media platforms in shaping the narrative of modern work environments. The synergy of data, platforms, and insights paves the way for a future where understanding transcends numbers, providing a holistic view of the digital realm. Welcome to the intersection of data mastery and collaborative evolution.
Newsletter
If you liked this post, sign up to get updates in your email when I write something new! No spam ever.
Subscribe to the Newsletter